2 Soil spectroscopy tools and users
You are reading the work-in-progress of the SoilSpec4GG manual. This chapter is currently draft version, a peer-review publication is pending.
2.1 Registered soil spectral libraries in OSSL
2.1.1 KSSL.SSL
Description: MIR and NIR spectral library and associated soil characterization database, which now includes >80,000 MIR spectra collected on soils primarily from the United States.
- 📕 Seybold, C. A., Ferguson, R., Wysocki, D., Bailey, S., Anderson, J., Nester, B., … & Thomas, P. (2019). Application of Mid‐Infrared Spectroscopy in Soil Survey. Soil Science Society of America Journal, 83(6), 1746-1759. https://doi.org/10.2136/sssaj2019.06.0205 / Sanderman, J., Savage, K., & Dangal, S. R. (2020). Mid‐infrared spectroscopy for prediction of soil health indicators in the United States. Soil Science Society of America Journal, 84(1), 251-261. https://doi.org/10.1002/saj2.20009
- 🔗 Project website: https://ncsslabdatamart.sc.egov.usda.gov/
- ©️ Data license: CC-BY
- 📍 Unique sites: 9,061
- 📋 Unique complete measurements: 76,813 (MIR) and 19,807 (VisNIR)
- 📝 Import steps: ossl-imports/dataset/KSSL
2.1.2 ICRAF.ISRIC
Description: A Globally Distributed Soil Spectral Library Mid Infrared Diffuse Reflectance Spectra. MIR measurements for some 785 profiles from the ISRIC World Soil Reference Collection. The samples are from 58 countries spanning Africa, Asia, Europe, North America, and South America.
- 📕 World Agroforestry Centre, (2014). The ICRAF/ISRIC spectral library, Soil-Plant Spectral Diagnostics laboratory, United
Nations Avenue, Nairobi, Kenya. https://doi.org/10.34725/DVN/MFHA9C
- 🔗 Project website: ISRIC Data Hub.
- ©️ Data license: CC-BY 4.0
- 📍 Unique locations: 785
- 📋 Unique complete measurements: 4308
- 📝 Import steps: ossl-imports/dataset/ICRAF_ISRIC
2.1.3 LUCAS.SSL
Description: LUCAS 2009, 2015 top-soil data. VisNIR measurements of some 19,860 in 2009 (2012) and 21,859 points in 2015. Data available publicly under condition that “Graphical representation of individual units on a map is permitted as far as the geographical location of the soil samples is not detectable”. Additional 600 samples have been scanned by Woodwell Climate Research using an MIR instrument.
- 📕 Jones, A, Fernandez-Ugalde, O., Scarpa, S., (2020). LUCAS 2015 Topsoil Survey. Presentation of dataset and results, EUR 30332 EN, Publications Office of the European Union: Luxembourg, ISBN 978-92-76-21080-1, doi:10.2760/616084, JRC121325.
- 🔗 Project website: https://esdac.jrc.ec.europa.eu/resource-type/soil-point-data
- ©️ Data license: JRC License Agreement
- 📍 Unique locations: 41,719
- 📋 Unique complete measurements: 41,719
- 📝 Import steps: ossl-imports/dataset/LUCAS
2.1.4 AFSIS1.SSL
Description: Africa Soil Information Service (AfSIS) Soil Chemistry Phase I. MIR and VisNIR measurements of 1903 georeferenced soil samples collected from 19 countries in Sub-Saharan Africa including a suite of wet chemistry data. Data available publicly under Open Data Commons Open Database License (“ODbL”) version 1.0, with attribution to AfSIS. Data retrieved from: https://registry.opendata.aws/afsis/ and https://doi.org/10.34725/DVN/QXCWP1.
- 📕 Vågen, T.-G., Winowiecki, L.A., Desta, L., Tondoh, E.J., Weullow, E., Shepherd, K., Sila, A., (2020). Mid-Infrared Spectra (MIRS) from ICRAF Soil and Plant Spectroscopy Laboratory: Africa Soil Information Service (AfSIS) Phase I 2009-2013. https://doi.org/10.34725/DVN/QXCWP1, World Agroforestry - Research Data Repository, V1, UNF:6:bMN2MBGqFewDKHPgIeRjog== [fileUNF].
- 🔗 Project website: http://africasoils.net/services/data/soil-databases/
- ©️ Data license: Open Database License (“ODbL”)
- 📍 Unique locations: 1903
- 📋 Unique complete measurements: 3806
- 📝 Import steps: ossl-imports/dataset/AFSIS
2.1.5 AFSIS2.SSL
Description: Africa Soil Information Service (AfSIS) Soil Chemistry Phase II. The three datasets for Tanzania (https://doi.org/10.34725/DVN/XUDGJY), Ghana (https://doi.org/10.34725/DVN/SPRSFN) and Nigeria (https://doi.org/10.34725/DVN/WLAKR2). Documentation of the datasets is available in Hengl et al. (2021). Data has been analyzed at the ICRAF Soil-Plant Spectral Diagnostics Laboratory, Nairobi, and the Rothamsted Research. From the 31,269 soil measurements, only 820 (2.6%) have reference data attached to it.
- 📕 Hengl, T., Miller, M.A.E., Križan, J., Shepherd, K.D., Sila, A., Kilibarda, M., Antonijevi, O., Glušica, L., Dobermann, A., Haefele, S.M., McGrath, S.P., Acquah, G.E., Collinson, J., Parente, L., Sheykhmousa, M., Saito, K., Johnson, J-M., Chamberlin, J., Silatsa, F.B.T., Yemefack, M., Wendt, J., MacMillan, R.A., Wheeler I. and Crouch, J. (2021) African soil properties and nutrients mapped at 30 m spatial resolution using two-scale ensemble machine learning. Scientific Reports, 11, 6130. https://www.nature.com/articles/s41598-021-85639-y.
- 🔗 Project website: https://data.worldagroforestry.org/dataverse/icraf_soils
- ©️ Data license: Creative Commons — CC0 1.0 Universal
- 📍 Unique locations: 367
- 📋 Unique complete measurements: 820
- 📝 Import steps: ossl-imports/dataset/AFSIS2
2.1.6 CAF.SSL
Description: The Central African Soil Spectral Library. MIR measurements of some collected based on 1800 samples in Central Africa.
- 📕 Summerauer, L., Baumann, P., Ramirez-Lopez, L., Barthel, M., Bauters, M., Bukombe, B., Reichenbach, M., Boeckx, P., Kearsley, E., Van Oost, K., Vanlauwe, B., Chiragaga, D., Heri-Kazi, A. B., Moonen, P., Sila, A., Shepherd, K., Bazirake Mujinya, B., Van Ranst, E., Baert, G., Doetterl, S., and Six, J. (2021). The central African soil spectral library: a new soil infrared repository and a geographical prediction analysis, SOIL, 7, 693–715, https://doi.org/10.5194/soil-7-693-2021
- 🔗 Project website: https://github.com/laura-summerauer/ssl-central-africa
- ©️ Data license: CC-BY?
- 📍 Unique locations:
- 📋 Unique complete measurements: 1852
- 📝 Import steps: ossl-imports/dataset/CASSL
2.1.7 SCHIEDUNG.SSL
Description: Dataset to the manuscript Schiedung et al. (2022). MIR measurements of 284 samples from high-latitude forest soils of Canada. DOI: https://doi.org/10.5281/zenodo.6024831.
- 📕 Schiedung, M., Bellè, S.-L., Malhotra, A., & Abiven, S. (2022). Organic carbon stocks, quality and prediction in permafrost-affected forest soils in north Canada. CATENA, 213, 106194. https://doi.org/10.1016/j.catena.2022.106194.
- 🔗 Project website: https://doi.org/10.5281/zenodo.6024831
- ©️ Data license: CC-BY 4.0
- 📍 Unique locations: 289
- 📋 Unique complete measurements: 259
- 📝 Import steps: ossl-imports/dataset/Schiedung
2.1.8 GARRETT.SSL
Description: A soil dataset from the FR380 trial series spanning 35 Pinus radiata forest sites in New Zealand. The dataset underpins three existing publications by Watt et al. (2005; 2008) and Ross et al. (2009) which details sample sites and the time zero (i.e. time of tree planting) sample collection and testing method. The publication by Garrett et al. (2022) details the soil mid-infrared spectroscopy method and extension on soil chemistry testing using the same time zero samples. A total of 184 samples have publicly available MIR measurements.
- 📕 Garrett, L. G., Sanderman, J., Palmer, D. J., Dean, F., Patel, S., Bridson, J. H., & Carlin, T. (2022). Mid-infrared spectroscopy for planted forest soil and foliage nutrition predictions, New Zealand case study. In Trees, Forests and People (Vol. 8, p. 100280). https://doi.org/10.1016/j.tfp.2022.100280.
- 🔗 Project website: https://doi.org/10.6084/m9.figshare.20506587.v2
- ©️ Data license: CC-BY 4.0
- 📍 Unique locations: 35
- 📋 Unique complete measurements: 184
- 📝 Import steps: ossl-imports/dataset/Garrett
2.1.9 SERBIA.SSL
Description: The Serbian SSL is a dataset with 135 samples shared by University of Novi Sad and published in Jović et al. (2019). The soil samples were sampled in 2009. Samples were taken from three different types of soil: arable, meadow, and forest, with 3 different depths: 0-30 cm, 30-60 cm and 60-90 cm for each location (n=45). Classical wet chemistry analyses includes texture, carbon total, carbon organic, carbon inorganic, pH, C/N ratio, and CaCO3. Only texture has complete data for all depths, the other soil properties were determined only for the 0-30 cm layer. The spectra in the MIR range were taken for all depths using a ThermoFisher Nicolet Nexus 670 with a DTGS detector, diffuse reflectance module, and gold as background reference. MIR spectra were obtained in the spectral range of 400-4000 cm-1 in duplicates. The coordinates of the sampling sites are given with lower precision.
- 📕 Jovića, B., Ćirićb, V., Kovačevića, M., Šeremešićb, S., Kordića, B. (2019). Empirical equation for preliminary assessment of soil texture. In Spectrochimica Acta Part A: Molecular and Biomolecular Spectroscopy (Vol. 206, p. 506-511). https://doi.org/10.1016/j.saa.2018.08.039.
- 🔗 Project website: https://doi.org/10.1016/j.saa.2018.08.039
- ©️ Data license: CC-BY 4.0
- 📍 Unique locations: 45
- 📋 Unique complete measurements: 135
- 📝 Import steps: ossl-imports/dataset/Serbia
2.2 Soil Spectroscopy Instruments
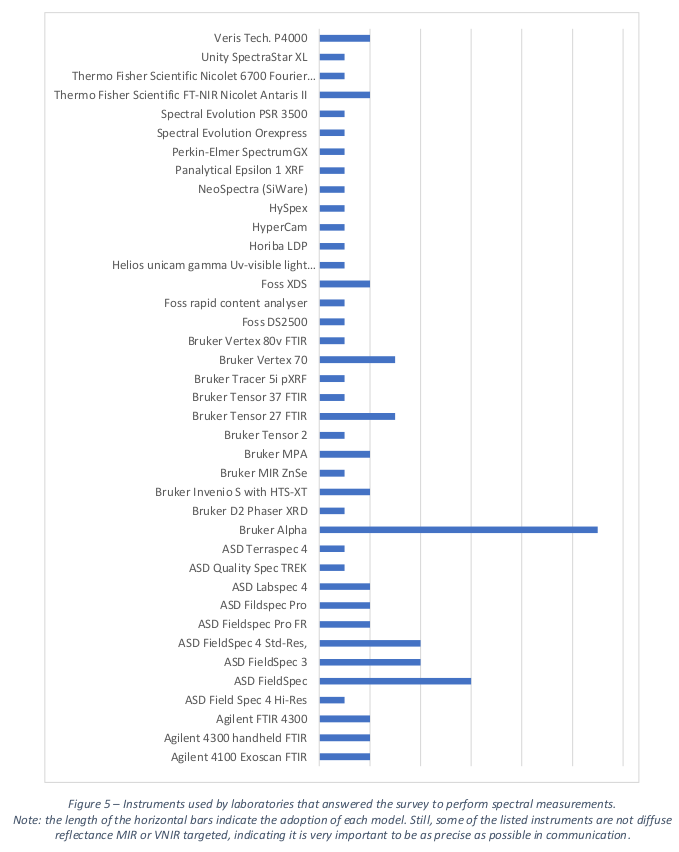
Figure 2.1: Most frequently used MIR / VISNIR instruments based on Benedetti & van Egmond (2021).
2.2.1 Bruker Alpha 1 FT-MIR ZnSe
- 🆔 Bruker_Alpha1_FT.MIR.Zn.Se
- 🏭 Producer: Bruker
- 🔗 Documentation: https://www.bruker.com/
- 📂 Model type: MIR (4000-400 cm-1)
- 📅 Production year: 2012
2.2.2 Bruker Alpha 1 FT-MIR KBr
- 🆔 Bruker_Alpha1_FT.MIR.KBr
- 🏭 Producer: Bruker
- 🔗 Documentation: https://www.bruker.com/
- 📂 Model type: MIR (4000-400 cm-1)
- 📅 Production year: 2012
2.2.3 Bruker Vertex 70 with HTS-XT accessory
- 🆔 Bruker_Vertex_70.HTS.XT
- 🏭 Producer: Bruker
- 🔗 Documentation: https://www.bruker.com/en/products-and-solutions/infrared-and-raman/ft-ir-research-spectrometers/vertex-research-ft-ir-spectrometer.html
- 📂 Model type: MIR (4000-400 cm-1)
- 📅 Production year: 2012
2.2.4 ASD Labspec 2500 with Muglight accessory
- 🆔 ASD_Labspec_2500_MA
- 🏭 Producer: Malvern Panalytical Ltd / Spectris
- 🔗 Documentation: https://www.malvernpanalytical.com/en/products/product-range/asd-range/labspec-range
- 📂 Model type: NIR (350nm - 2500nm)
- 📅 Production year: 2018
2.2.5 ASD FieldSpec FR
- 🆔 ASD_FieldSpec_FR
- 🏭 Producer: Analytical Spectral Devices, Inc.
- 🔗 Documentation: https://www.laboratorynetwork.com/doc/fieldspec-pro-fr-portable-spectroradiometer-0001
- 📂 Model type: NIR (350nm - 2500nm)
- 📅 Production year: 2016
2.2.6 XDS Rapid Content Analyzer
- 🆔 XDS_Rapid_Content_Analyzer
- 🏭 Producer: FOSS NIRSystems Inc.
- 🔗 Documentation: https://www.selectscience.net/products/xds-rapid-content-analyzer/?prodID=106696
- 📂 Model type: NIR (Si 400–1100 nm and PbS 1100–2500 nm detectors)
- 📅 Production year: 2008
2.3 Soil spetroscopy organizations
National and regional soil spectral laboratories actively processing soil samples and providing soil spectroscopy services, and other organizations and companies producing or using soil spectroscopy data.
See also: The Global Soil Laboratory Network (GLOSOLAN)
2.3.1 KSSL
- 📛 Name: The Charles E. Kellogg Soil Survey Laboratory (KSSL)
- 📫 Address: USDA-NRCS-NSSC, Federal Building, Room 152, Mail Stop 41/51, 100 Centennial Mall North Lincoln, NE 68508-3866, USA
- 🔗 Organization website; Database
- 🔬 Types of services: USDA soil laboratory, MIR, VisNIR.
2.4 Soil Spectroscopy software
Open source and commercial software used to process soil spectral measurements. See also this detailed review of software used for soil spectroscopy. Even more in-depth review of R packages used for soil spectroscopy can be found in Wadoux, Malone, McBratney, Fajardo, & Minasny (2021). A list of available R packages for processing and analyzing spectral data:
2.4.1 opusreader2
- 📛 Name: opusreader2
- 💼 Specialty: Read OPUS binary files from Fourier-Transform Infrared (FT-IR) spectrometers of the company Bruker Optics GmbH & Co. in R
- 💻 Programming language: R project
- 🔗 Homepage: https://github.com/spectral-cockpit/opusreader2
- 📕 Baumann P, Knecht T, Roudier P (2023). opusreader2: Read spectroscopic data
from Bruker OPUS binary Files. R package version 0.5.0, https://github.com/spectral-cockpit/opusreader2.
- ©️ License: MIT
- 📧 Maintainer: spectral-cockpit
2.4.2 asdreader
- 📛 Name: asdreader
- 💼 Specialty: Reading ASD binary files in R
- 💻 Programming language: R project
- 🔗 Homepage: https://github.com/pierreroudier/asdreader
- 📕 Roudier, P. (2020). asdreader: reading ASD binary files in R. R package version 0.1-3 CRAN.
- ©️ License: GPL
- 📧 Maintainer: Pierre Roudier
2.4.3 prospectr
- 📛 Name: prospectr
- 💼 Specialty: Signal processing, resampling
- 💻 Programming language: R project
- 🔗 Homepage: https://github.com/l-ramirez-lopez/prospectr
- 📕 Stevens, A., & Ramirez-Lopez, L. (2022). An introduction to the prospectr package. R Package Vignette. R Package Version 0.2.6.
- ©️ License: MIT + file LICENSE
- 📧 Maintainer: Leornardo Ramirez-Lopez
2.4.4 simplerspec
- 📛 Name: simplerspec
- 💼 Specialty: Soil and plant spectroscopic model building and prediction
- 💻 Programming language: R project
- 🔗 Homepage: https://philipp-baumann.github.io/simplerspec
- 📕 Baumann, P. (2020). simplerspec: Soil and plant spectroscopic model building and prediction. Packages R CRAN.
- ©️ License: GNU General Public License v3.0
- 📧 Maintainer: Philipp Baumann
2.4.5 resemble
- 📛 Name: resemble
- 💼 Specialty: Memory-based learning in spectral chemometrics
- 💻 Programming language: R project
- 🔗 Homepage: https://github.com/l-ramirez-lopez/resemble
- 📕 Ramirez-Lopez, L., and Stevens, A., and Viscarra Rossel, R., and Lobsey, C., and Wadoux, A., and Breure, T. (2022). resemble: Regression and similarity evaluation for memory-based learning in spectral chemometrics. R package Vignette. R package version 2.2.1.
- ©️ License: MIT + file LICENSE
- 📧 Maintainer: Leonardo Ramirez Lopez